The Daily Market Forecast... Lesson Day
Today’s Lesson: You can’t win every day.
Last week our strategies had a record week. To be fair, it’s highly unlikely that anyone on the team duplicated that performance. But the “baseline” for the rules followed did have a monster week.
Price moves in waves of impulses and corrections. Your trading account is likely to do the same thing. There is no logical reason to assume this week will be the same as last week. Or, that it will be a losing week giving back some of the gains. We just don’t know.
Your viewpoint every day (week, month) should be positive. There is no benefit in thinking negative. The gravy train ends when it ends. It’s important to maintain the positive outlook BUT understand that a losing streak, which will happen, is not bad. It’s just temporary… assuming your rule set has edge.
For a review of each of those trades watch the video of Saturday’s LookBack (5) session. Click here.
Trade Well,
Mike Siewruk
P.S. Join us every Saturday morning @ 10:00 ET for our we...
The Daily Market Forecast... compartmentalization
Today’s Lesson: Compartmentalization (a mouthful of a word but the best I could find for this topic).
Here’s the setup: you have a 401-K (long only) and you trade short term for income (long and short). Every morning you go through your routine which includes assessing two time horizons:
- The big picture. Trends on monthly and weekly charts. You WANT these up for your 401-K.
- Today. Will it be a narrow or wide day? Up or down? What catalysts are evident? You don’t care about direction, just movement.
Do you see the challenge? For your bigger account you WANT the market to continue higher. For your trading account you’re willing to trade short, AGAINST what you really WANT.
You may not realize but you could have a confidence issue with your short-term trading. You’re in conflict. Heck, in a Bear Market your confidence issue switches to your investment account!
Think about this while trading short. If you have any angst then knowing the cause (your WANT) is the first step to “rec...
The Daily Market Forecast... failure teaches

Today’s Lesson: Failure teaches.
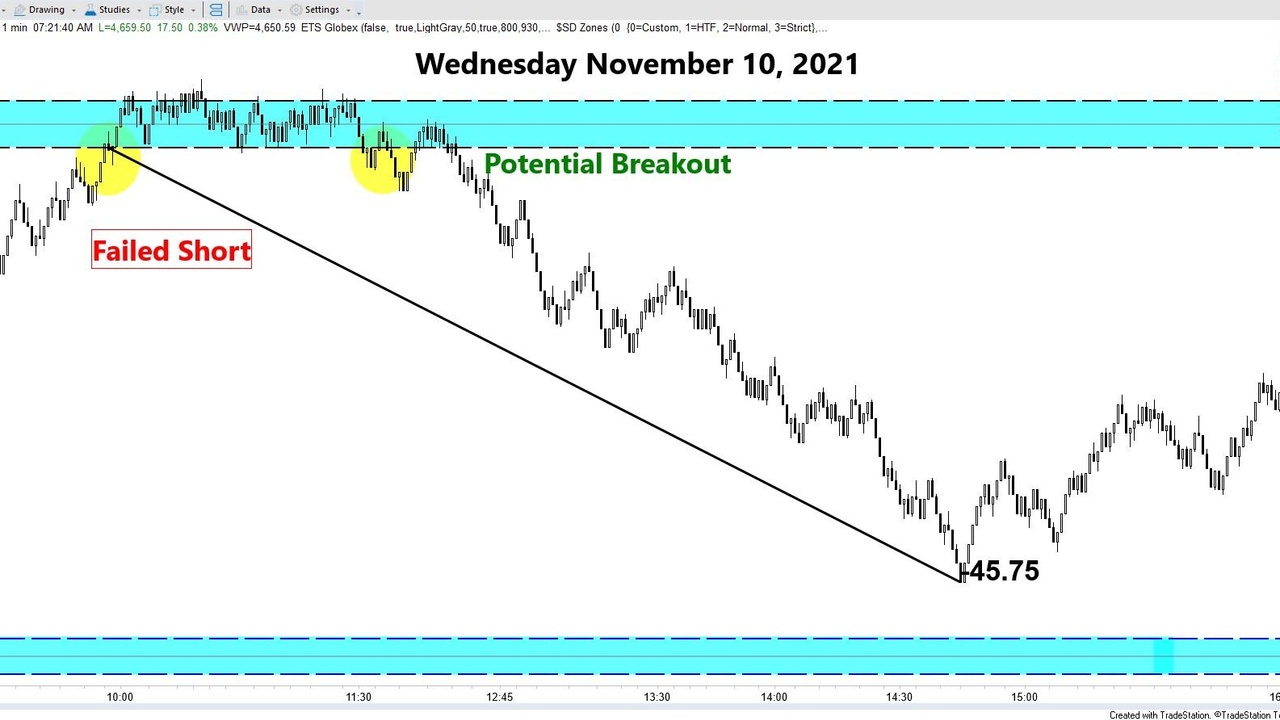
Yesterday’s short trade stopped out only 1.5 points from the day session high. Price then plummeted 45+ points. Instead of a solid payday you paid out. Are you upset? Critical? Sad?
Having a positive attitude about your trading is important. Banish those negative thoughts and blame. Reframe the results of a trade like this one to the positive.
Let’s review the trade plan from yesterday. The Long Level was down at 4619.75. The comment following the long suggestion was “That’s a long way down and unlikely today, but what does that tell you about the short suggested above?”
Did the short level work out? Did the vast distance to the next level almost get filled? Was it a great short entry? Yes, yes, yes.
The fact that you missed the run by a small margin doesn’t negate a well-planned trade. Instead of fostering negative emotions about this result focus on the positive. Learn from the failure. What could you do differently the next time?
One obvious a...
The Daily Market Forecast... tops and bottoms

Today’s Lesson: Breakout rules.
Since the winning short yesterday was a 25-point breakout trade (see chart), it’s timely to review rules of entry. You may be using different rules that are working for you. Stay the course. There is no “one and only way” to beat the market. The key is to find a strategy and style that is in harmony with your personality and time commitment.
The rules followed by the team here are simple and very effective for avoiding the “Fakeout” breakouts. We do miss a few because it’s a more conservative entry, but the stats over thousands of trades assure you the results are much better.
Here was the trade suggestion yesterday: “Short Level: If price closes BELOW 4693.25 short the retracement back there with a stop at 4698.75 (5.50 risk).”
Notice that the breakout was not taken simply because price TRADED below the level. A 2-point range candle (or 2-minute, tick or volume) had to CLOSE below. The short entry was then placed above at the limit entry price. This...
The Daily Market Forecast... winning streaks
Today’s Lesson: Call it a day?
How many wins in a row do you take before you quit? Since our strategies had a healthy 11 winners in a row yesterday this is a timely question.
Before we figure this out you should know that it is highly unlikely that you’ll duplicate the exact results of any strategy. There are trades you’ll miss, fills you won’t get, technology glitches, etc. When you hear or read about extreme success, please dial down your expectations of reality.
Even if you’re a seasoned trader with years of experience, winning trade after trade can really get your adrenaline flowing. It’s physiological. You just can’t stop it. This can lead to over confidence and poor judgement. You should have a rule in your plan.
There are a few schools of thought on when to quit a winning streak. All these philosophies are used by different traders on our team. Pick one that fits your personality.
- Set a dollar amount as your daily goal and quit when you reach it. This might be someone tra ...
The Daily Market Forecast... sleep trading

Today’s Lesson: Sleep trading.
The futures market opens at 6:00 PM ET. It’s called the Globex session and it is easier money than the day session. Why? The participants are different. Day session volume brings out all the big position traders and that creates a noisy effect on price action. Here’s 5 compelling reasons why you should take on this “night job…”
- The Globex session is less noisy meaning your stops will be filled less often.
- The best W/L ratio and highest profit time periods are from 18:00 to 9:30 ET. You can trade until noon, but the results will be less profitable.
- Breakout trades in the first 30 minutes of the Globex are incredible. Reversals are not.
- There are 10 “sessions” every week. 5 during the day, 5 Globex. Of those 10, the TOP 4 profit-wise are Globex.
- You can set/forget your trades before you retire for the night.
If you’re thinking “I don’t have the time to analyze the market and KNOW where to place those Globex trades” then you’re in luck. We provide...
The Daily Market Forecast... recycle this indicator

Today’s Lesson: A new use for ATR
Welles Wilder was mentioned yesterday when explaining a use for his Parabolic SAR. Possibly his most famous indicator is ATR (Average True Range). The word “true” in the name refers to the fact that this includes gaps in the calculation. Average Range would not.
There are numerous ways to use ATR in your trading. One common way is to position your stop loss as a multiple of ATR, expecting that price won’t go there (anytime soon). Likewise, you can use it for profit targets.
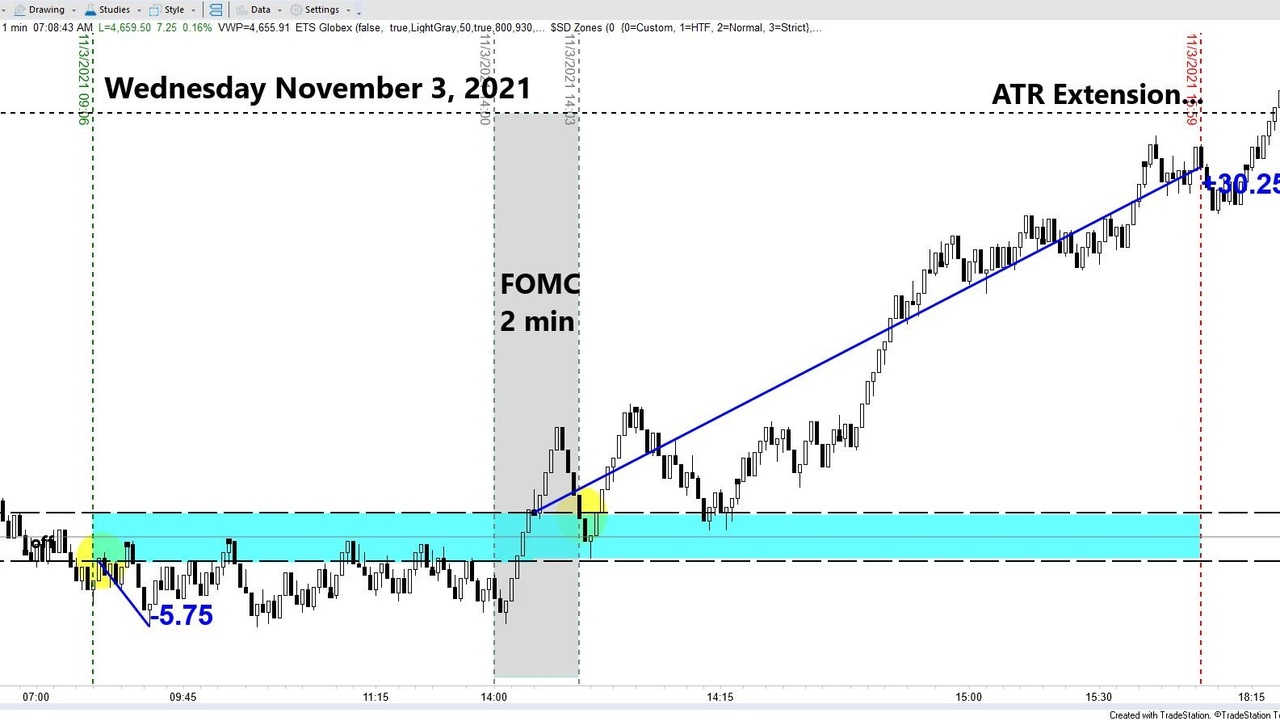
One way I’ve found that can be uncannily accurate is ATR Extension. Looking at the chart above you’ll see a dotted line near the top. This was the ATR added to the prior day’s close. There is another (unseen on the chart) line for ATR subtracted from the prior day’s close.
These ATR extensions act like magnets when price runs far. They can be stalls, reversals or simply profit targets. Think about it, price has made an extended move and could be getting tired. As with all techni...
The Daily Market Forecast... Lesson Day
Today’s Lesson: Trail Stopping
The idea of moving your stop loss automatically so it follows or “trails” price moving in your direction is alluring. The main deficit is that price can be “noisy” moving in choppy impulses and corrections that trigger the stop. You’ll miss plenty of great moves.
On the contrary, you don’t want to leave your stop the same after price has moved well in your favor but not to your profit target yet. Watching a winning trade lose is painful and unnecessary.
There are several ways to place a trailing stop. The first decision you must make is whether you want to manually adjust it or not. For automatic trailing stops any decent trading platform will allow you to enter the stop by points/dollars or percentage. If your initial stop is 4 points away, let that be the trailing stop. Easy enough.
If you’re willing to manually move the stop there are chart patterns and indicators that can smooth out the noise of the price move. Price pivots and moving averages are...
The Daily Market Forecast... confluence
Today’s Lesson: Power in confluence.
You have a trade plan with specific rules of entry and exit that produce a positive expectation (if not, get one or quit trading). If EVERY trader used the same plan and followed it precisely there would be no one to trade against.
You WANT and NEED traders to do something different than you. This is a good thing. Now if you want to step up your performance you’ll learn OTHER popular trading strategies. Not necessarily to trade them, but to consider what OTHERS may be doing at the same time.
Here's a simple example: the 20-period moving average is a popular technical indicator. You may not use it because it is a lagging indicator or you haven’t been taught HOW to make it work. Regardless, there are traders who use it. Put it on your chart.
Why? Because if your strategy is getting a signal to enter around there you might be finding some confluence (with other trade plans). If you’re short in the trade and wondering about a good profit target, app...
The Daily Market Forecast... think global
Today’s Lesson: Think global.
Successful investors and traders alike have a rule-based strategy that provides them a financial advantage or “edge.” A combination of fundamental and technical analysis are typical components. Another analysis you can add to the recipe is investor “mood” commonly called sentiment. In other words, do market participants feel bullish, bearish or neutral about the future?
While every region and country has a unique economy, given the volume of international trade those individual economies are part of a larger “global” economy. The U.S. economy is the largest in the world but more importantly for us it is also the last market traded on the daily clock. This allows U.S. traders a glimpse at how the Asian and European markets are trading before our stock market opens.
Many years ago, I developed a simple indicator for world sentiment, which I call the World Index. The foundation of which is the daily cash market percentage change of the major Asian and Euro...
