The Daily Market Forecast... Night School Rocks!
Thursday’s Results: Buying 4416.25 failed the reversal pre-market and failed the breakout during the day session.
Quick Tip: Night School Rocks!
With distance learning common today night school might be losing popularity.
But NOT in the futures, Forex, and crypto markets. These assets trade all night long. You should be planning trades for what is called the Globex (night) session in the futures market. Set and forget while you sleep.
What is equally important about the Globex session is the clues and edge it can give your Day session trading. You should study the Globex data on assets you trade. Patterns and edge will emerge. It may change from time to time so keep your research updated.
Here’s an example: The S&P futures is modestly active in the Globex. The volume is a small fraction of the day session, but enough to analyze. Measure the range of the session (from 6PM to 9:30AM ET). This is a great way to forecast the range of the day session. Usually, a wide Globex leads to...
The Daily Market Forecast... Courage or Confidence?

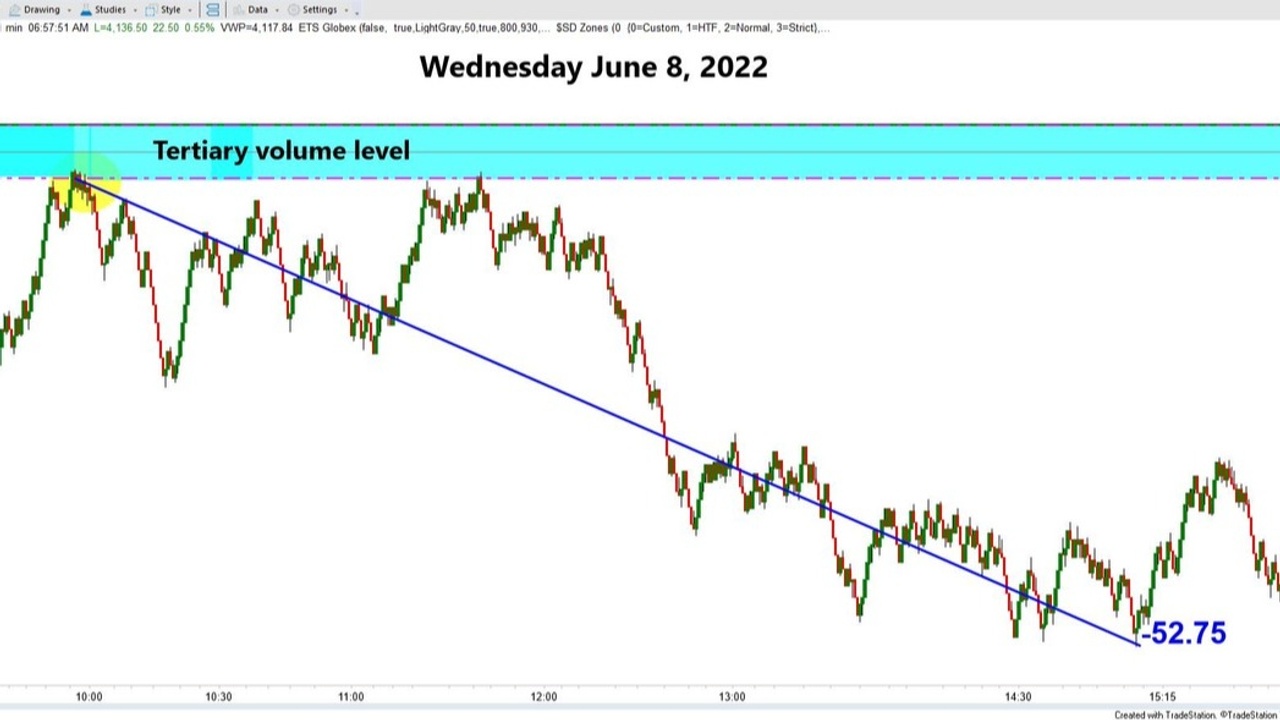
Wednesday’s Results: Shorting 4158 offered 52.75 points before closing the day +43 points.
Quick Tip: Courage or Confidence?
You’ve probably experienced that trade setup that just didn’t look or feel right. The rules say “Short” but price is skyrocketing. All you can think about is that stop getting filled instantly and you’re underwater again. Sound familiar?
On the chart above, notice the momentum leading into the suggested short level. The parabolic move up came within ONE TICK of filling your short entry.
Taking that short against that momentum felt wrong. But it wasn’t. Hard evidence over thousands of trades showed the probability was in your favor.
Would it take “courage” to enter that trade? Being courageous sounds too risky to me. I get mental images of danger ahead and I’m supposed to plow right through and prevail… without pain?
Then it retraced several points. Relief! That level may work out!
Confidence is the “real” courage in trading. It’s knowing from years of stu...
The Daily Market Forecast... Learn to Reframe

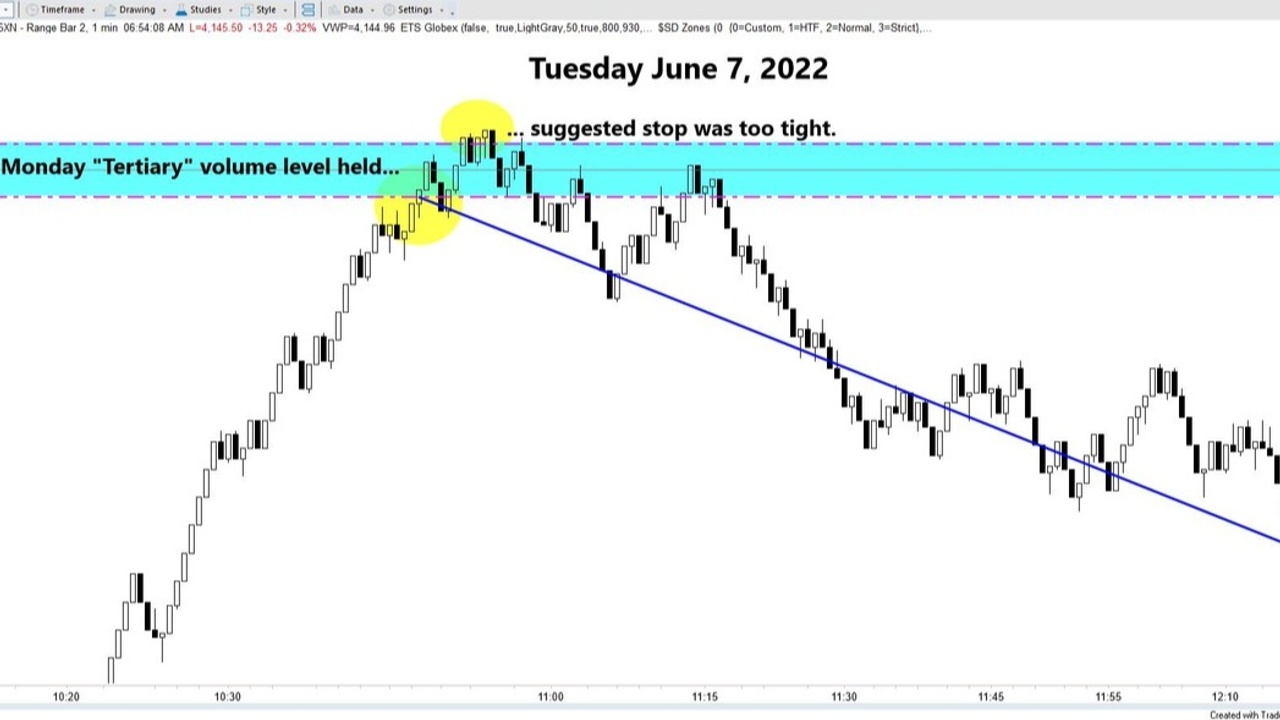
Tuesday’s Results: The suggested short stopped out.
Quick Tip: Learn to Reframe
Yesterday’s short trade @ 4133.50 stopped out by one tick! Price then plummeted 25+ points. Instead of a solid payday you paid out. Are you upset? Critical? Sad?
Having a positive attitude about your trading is important. Banish those negative thoughts and blame. Reframe the results of a trade like this one to the positive.
Here’s how: Ask yourself, overall did the short level work out? Did the trade run plenty? Was it a great short entry? Yes, yes, yes.
The fact that you missed the run by a small margin doesn’t negate a well-planned trade. Instead of fostering negative emotions about this result focus on the positive. Learn from the failure. What could you do differently the next time? Widen your stops, reduce size if needed. Or accept “subsequent-touch” entries. In this case it worked well.
That’s how a successful trader turns today’s loser into tomorrow’s winner.
Today’s Best S&P Turning Points:
...The Daily Market Forecast... Nifty Evidence

Monday’s Results: Neither suggested level triggered.
Quick Tip: Nifty Evidence
Filtering your trade entries/exits by time-of-day is a great way to optimize your trade selection. The side benefit is that you know when you’ll be trading and when you can focus on other things.
How you look at the data is the key. By imagining different ways to look at “time” you can find uncommon edge.
Here’s a great example: In the histograms above every bar is 30 minutes starting at 8:30 ET and ending at 16:00 ET. The bars represent the average range of that 30-minute time slot in DOLLARS.
Why dollars? Because futures contracts have different “point” values. The ES contract is $50/point. Oil is $1000/point. Gold is $100/point. To compare them you can normalize the ranges to their equivalent dollar values.
By looking at time-of-day this way you can laser-focus your trade entries for each asset to when the most movement is likely to occur. Study those three histograms. Every asset has a different ti...
The Daily Market Forecast... Think Like a CEO
Friday’s Results: Neither suggested level triggered.
Quick Tip: Think like a CEO.
You should manage your trading like a business. Even if you’re employed, think of it as a side business. You’re unlikely to have employees and that means you need to wear different “hats” to be successful. At times you will need to act the roles of CEO, CFO, and Trader.
The CEO creates the vision then ensures it becomes a reality. You are the author of the trading plan, documentation, and review processes. You are not mired in day-to-day performance. Your focus is on long term growth and goal attainment. Spend some time developing a written vision statement and goals (within your trade plan). Read them frequently when you’re wearing your CEO “hat” and especially when you’re facing performance challenges. This is great work to perform on the weekend, free from distraction of your other “hats.”
The CFO manages the money. Profits and losses. With trading this can be a daily job. The CFO mindset is critic...
The Daily Market Forecast... Optimizing Credit Spreads
Thursday’s Results: Neither suggested trade triggered.
Quick Tip: Optimizing Credit Spreads
Same-day expiration SPX credit spreads are extremely popular trades for income generation. Recently the CBOE has added Tuesday and Thursday expiration contracts proving the popularity of the trade. Now you can trade a different strategy for income 5 days a week.
If you’re not familiar with the trade here’s a brief explanation: You select a price level on the chart that you believe price will NOT touch/exceed today. For the Bear Call spread that level would be way above current price. For the Bull Put spread that level would be way below current price.
The trade is entered by selling a call/put for a credit and buying a protective call/put for a debit. You will net the difference. Your maximum risk on the trade is the difference between the strikes less what you were credited on the spread.
That’s a mouthful so let’s look at the numbers. A typical net credit may be $50 or so. With the spread...
The Daily Market Forecast... Get Another Strategy

Wednesday’s Results: Neither suggested trade triggered.
Quick Tip: Get Another Strategy
For the past two days neither of the best volumes levels offered here triggered. Patience required for sure. The alternative is to trade more than one strategy. The key is to find a strategy that is complementary, not competitive with the others in your toolbox.
Two popular styles to combine are breakout/reversal and trend following. Price is always in one of the two conditions: range-bound or trending. With practice you’ll hone your skill in choosing which to employ.
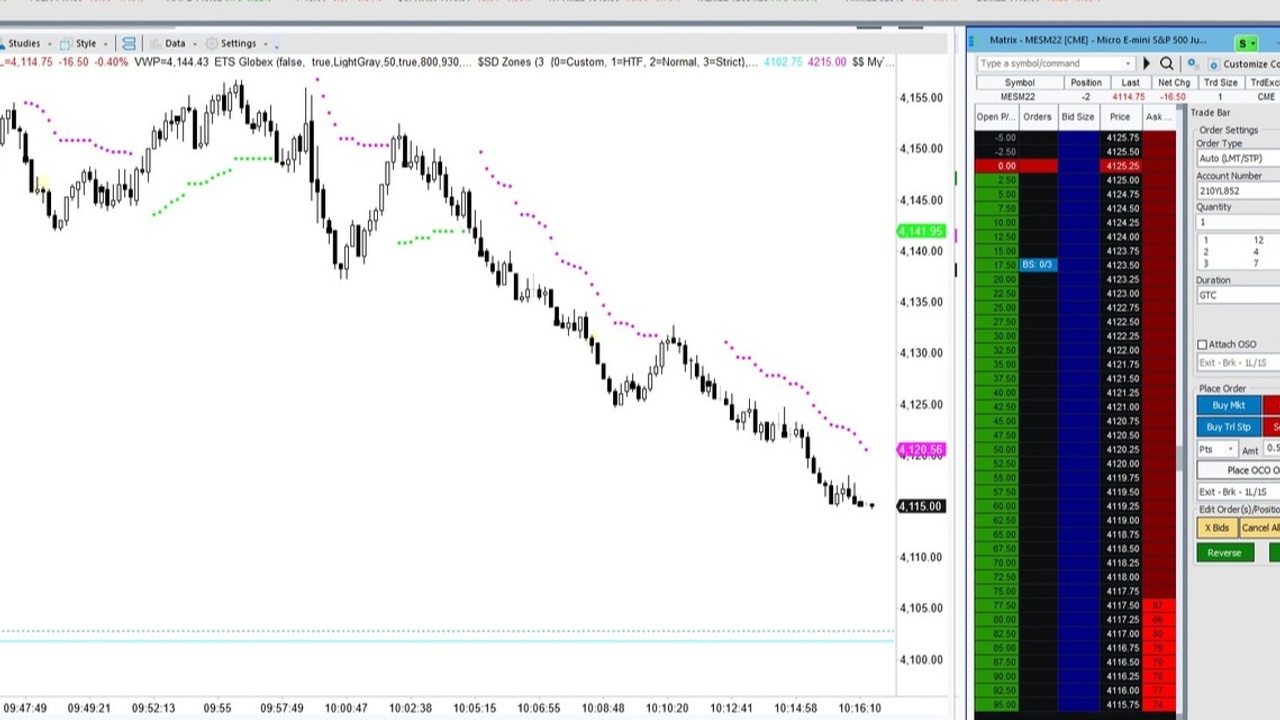
Yesterday’s chart of our new trend following strategy enjoyed the move down while our reversal strategy was waiting for the 4063.65 level suggested that never arrived.
Tuesday’s Results: Today’s Best S&P Turning Points (same as yesterday):
Sell 4292.50 stop 4297.50.
Buy 4063.75 stop 4058.00.
Trade Fearlessly,
Mike Siewruk
P.S. Did you know there are specific tools and formulas you can use to change your personal psychology a...
The Daily Market Forecast... Picture This
Tuesday’s Results: A choppy day didn’t trigger either suggested level.
Quick Tip: Picture This…
Most traders use price charts for some if not all their information gathering. The most common charts are viewed in time intervals (5, 15, 60 minutes, daily, weekly, etc.). Better trading platforms offer different “views” of price and can be extremely helpful when combined with time interval charts.
Try this exercise; in addition to your preferred time interval chart add a range bar and volume (share) bar chart to your workspace.
- Range charts will paint a new candle for every specified price movement. Trading the ES futures look at the difference using a 2-point range chart.
- Volume (share) charts will paint a new candle for every specified volume (share) amount traded. Trading the ES futures look at the difference using a 10,000 volume (share) chart.
Do you see trend any differently? Are the up/down moves more granular?
Time interval charts excel at showing wide and narrow range c...
The Daily Market Forecast... What You Did Right
Friday’s Results: The suggested short @ 4116.25 was only good for a 7-point “scalp.” The breakout long even less at 4.75 points.
Quick Tip: What You Did Right
If you’re a regular reader of this blog you know that documentation and review of all your trade setups (taken or not) is essential to improving your results.
It’s easy to skimp on this work by focusing on the losers. Your instinct is to understand why you lost. Was it something you did wrong? Could you discover a changed to your trade plan that is beneficial? Or, was it meant to be as a natural part of the win/lose paradigm?
An excellent method for reframing your attitude positive is to focus equally as much attention on what you did right. It’s too easy to ignore this. The trade worked. You were profitable. Why explore that? Because reinforcing through review and thoughtfulness what you did right will cement those good habits.
Whatever you feed your mind is what you’ll get in return. Focus more on the positive outcomes to ...
The Daily Market Forecast... Filter or Not?
Thursday’s Results: Neither suggested trade yesterday triggered.
Quick Tip: Filter or Not?
Are there market conditions that your strategy performs better or worse in? Probably so. Price is either trending or not and volatile or not. These are very different conditions and knowing with evidence how your strategy performs in each of them is important.
Why? Because you’ll be able to filter out trade setups in conditions that are not ideal. These filters become rules in your trade plan, which is a living document requiring this very type of updating.
You’ll need to document hundreds, even thousands of trades with several data points to find the evidence. One important data point to capture on every trade (taken or not) is the average true range (ATR) of your higher time interval. This tells you how volatile price is.
For example, our team day trades the S&P futures using volume profile (one of several strategies they can access to choose trades from). The best measure of volatility fo...
