The Daily Market Forecast... entry edge.

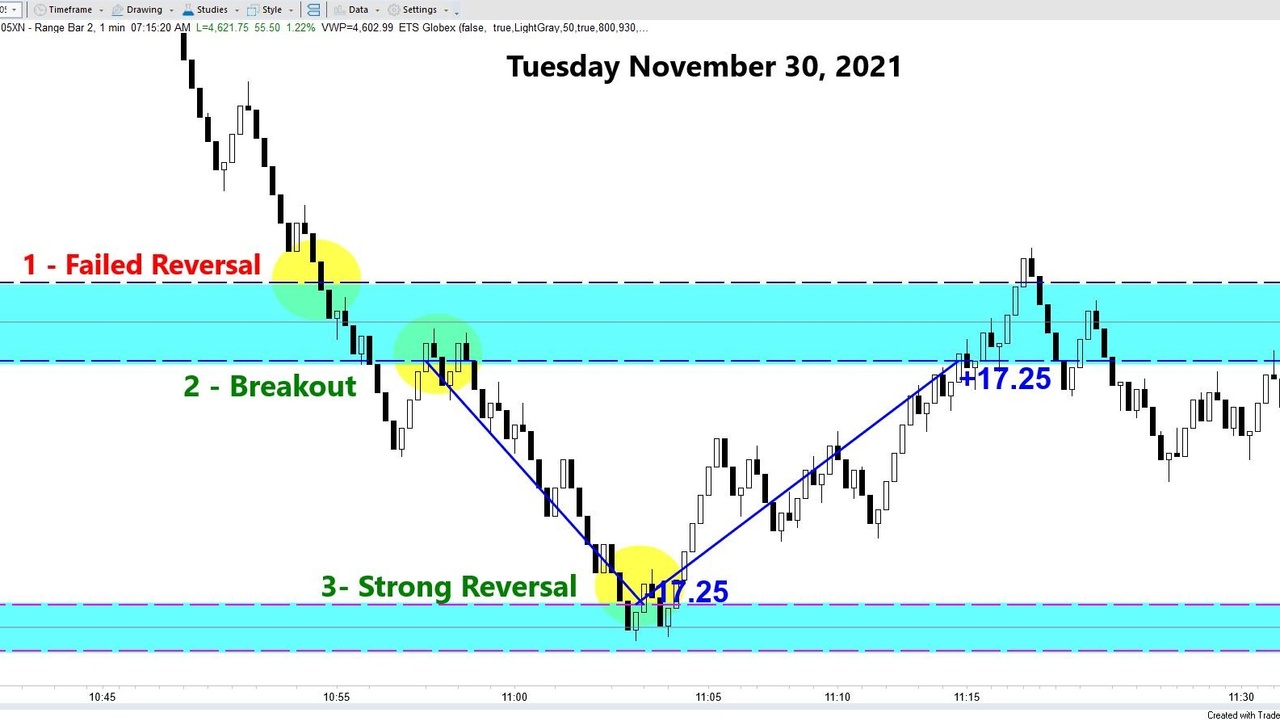
Wednesday’s Blog Results: You did well! The suggested long level ran 18 points on the first touch and 18.25 on the second (see chart). Team Members saw the breakout afterward that ran for 24.25 points to the next volume level (see chart).
Today’s Trading Tip: Entry “edge.”
The chart above has a few good trading tips. The strategy followed is called Volume Profile. Signals for entry both long and short, reversal and breakout, come from high volume price levels.
The entry rules are simple (follow on the chart):
- Reversal: Always enter at the first or “inside” line of the price level. Price reverses from within 1 point of that entry 31% of the time. If you’re waiting for a late entry to minimize risk you’re missing plenty of winning trades. Either accept the risk or lower your position size.
- Reversal: The second touch worked fine. Notice that price went deeper into the level. Second touches are fine but less effective. After a solid winner you may consider passing on the lower pro ...
The Daily Market Forecast... real good reversals

Tuesday’s Blog Results: You did well! The suggested long level ran 17.25 points to the next level. Team Members saw the breakdown just prior which also ran for 17.25 points (see chart).
Today’s Trading Tip: Real good reversals.
Yesterday was about finding your style. Trading trends and finding reversals were used as examples.
You might be thinking that trading the trend sounds safer than picking a turning point. Not necessarily. Your initial priority is making sure your rule set has “edge,” meaning over time it’s profitable. After you find that the idea of “safe” becomes irrelevant. Just trade the strategy that appeals to you psychologically.
Finding high quality reversals is easier than you may think. There are many clues on a price chart where the impulse will turn into a correction. Here’s one you should study to get comfortable with trading reversals. After all, confidence in your strategy is paramount and the smart way to get confident is research, documentation, and review. Y...
The Daily Market Forecast... trend or reversal?

Monday’s Results: The suggested short level stopped for a loss of 4.75 (per contract). Team members saw a smooth breakout south at the open run for 25+ points (see chart).
Today’s Trading Tip: Find your style.
There are many winning strategies. You need to trade only those that resonate with your personality. Otherwise, your confidence and performance will wane.
Here’s an example comparing two very popular styles of trading. Trend Following versus Reversal Trading. Regardless of the tools/indicators you use to enter and exit your trades…
- Trend Following will generally result in many small losing trades and fewer larger winning trades. The net result might look like this: 30% winning trades of $500 and 70% losing trades of $100 = $80 per trade profit.
- Reversal Trading will likely result in more winning trades that are somewhat larger than the losing trades. The net result might look like this: 60% winning trades of $200 and 40% losing trades of $100 = $80 per trade profit.
Not...
The Daily Market Forecast... Trader or CEO?

Wednesday’s Blog Results: The suggested long level failed in both the Globex and Day session for a 4.25-point loss (per contract). Team members saw an afternoon breakout good for 17.75-points at the close (see chart).
Today’s Trading Tip: Think like a CEO.
You should manage your trading like a business. Even if you’re employed, think of it as a side business. You’re unlikely to have employees and that means you need to wear different “hats” to be successful. You’re the CEO, CFO, and Trader.
The CEO creates the vision then ensures it becomes a reality. She is the author of the trading plan, documentation and review processes. She is not mired in day-to-day performance. Her focus is on long term growth and goal attainment. Spend some time developing a written vision statement and goals (within your trade plan). Read them frequently when you’re wearing your CEO “hat” and especially when you’re facing performance challenges.
The CFO manages the money. Profits and losses. With trading t...
The Daily Market Forecast... confidence

New feature: Daily S&P turning points
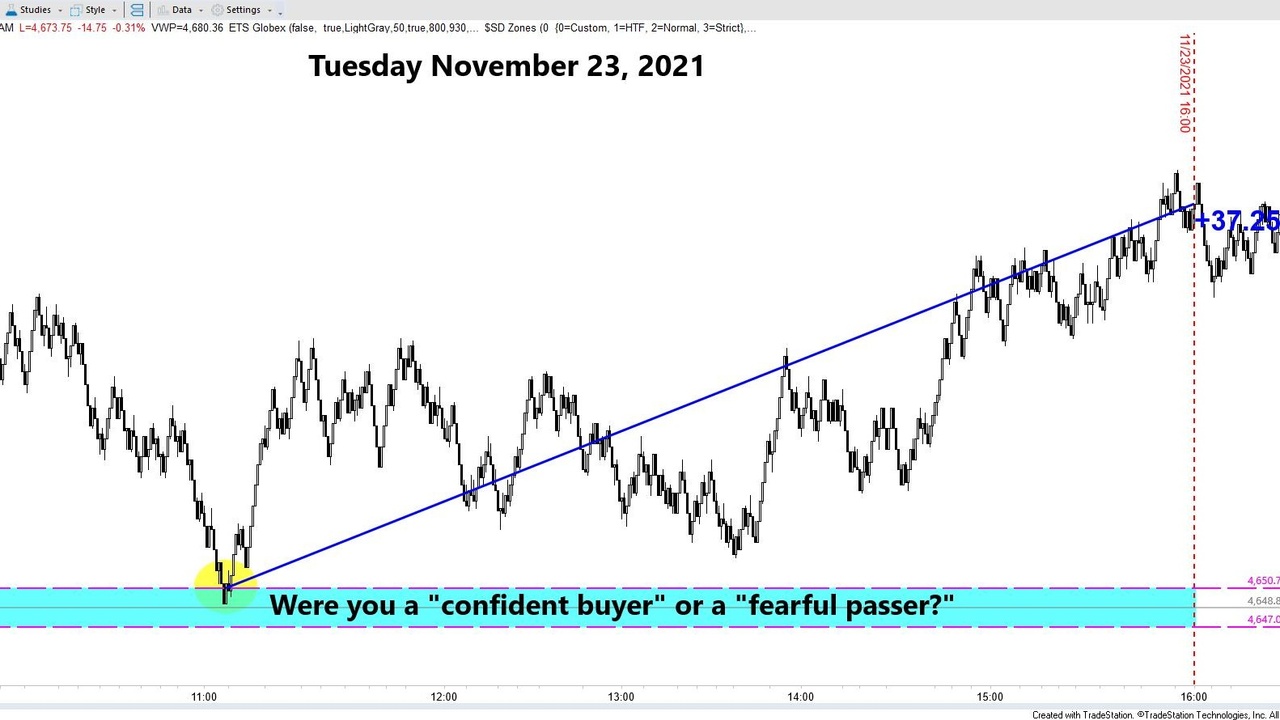
Tuesday’s Free Edition Results: You bought the bottom! The suggested long at 4650.75 was good for 37.25 at the close of the session.
Today’s Lesson: Confidence is key.
Let’s use the chart above to learn about confidence.
Context: Most world markets were bearish, ours is selling off fast for the past 60 minutes. Down 45+ points from the session-opening rally. You’re supposed to BUY. The old saying “don’t try to catch a falling knife” is repeating in your head. You lack confidence and you’re fearful of a loss so you “pass” on the trade.
Outcome: The strategy picked the bottom and ran for a healthy gain. Only 1.50 points of adverse move.
The Fix: You need to understand WHY a strategy has edge. It’s not enough to listen to a successful trader tell you THIS is the way it works. Until you OWN the confidence in the rules you won’t follow them.
Evidence: You can own confidence through experience for sure. But starting out that’s not possible. Then h...
The Daily Market Forecast... Hat Trick

New feature: Daily S&P turning points
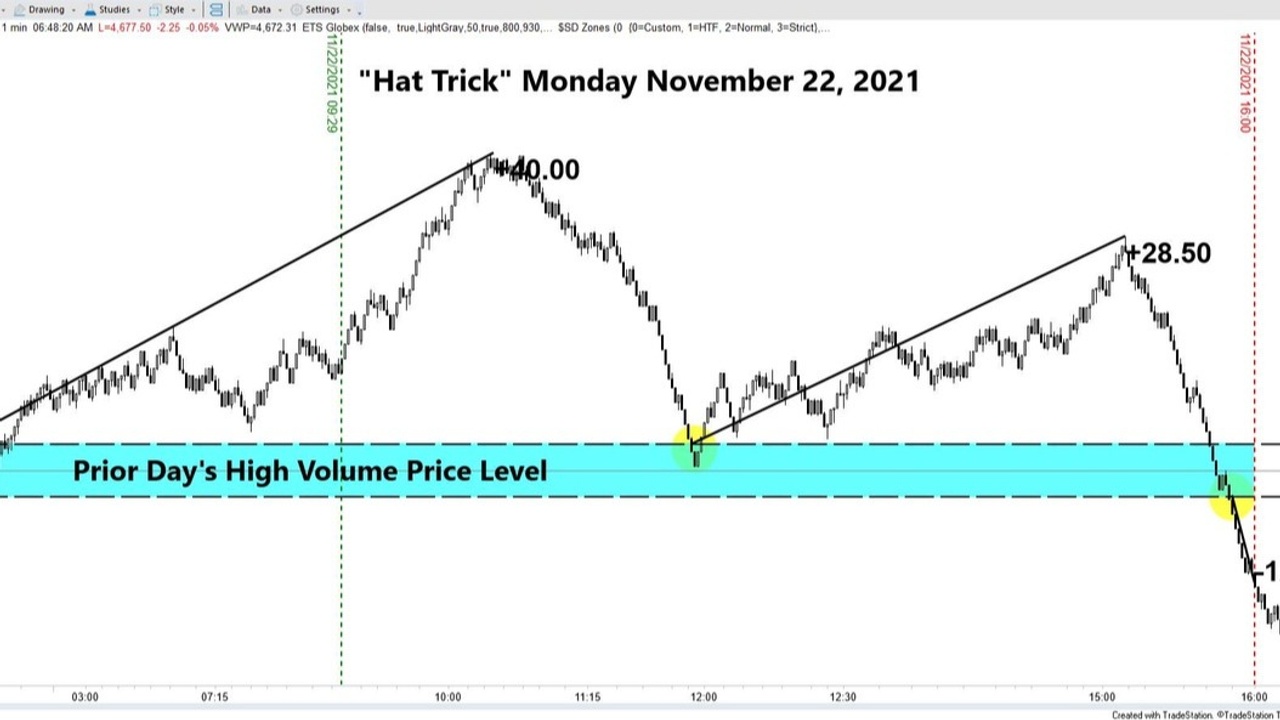
Monday’s Results: The suggested long 4700.50 was good for up to 28.50 points during the day session (after soaring 40 points in the Globex). The suggested short on the breakout below 4693.25 was good for 12 points at the close... 6 minutes later.
Today’s Lesson: Range, Tick & Volume charts.
Time-based candles are used most often and are sufficient for swing and position trading. When day trading, you can benefit from monitoring multiple chart types… range, tick and volume bars. Why? They frequently display a different “picture” of what price is doing. This information that is “hidden” in a time-based chart can be very helpful for honing your entries and exits.
The suggested short yesterday required price to trade below 4793.25 and then retrace back to that price for the short entry. The chart above is a 2-point range chart, meaning price paints a new candle after 2 points of movement. It’s more granular than a time-based chart. The dip below an...
The Daily Market Forecast... stocks long term
Today’s Lesson: Stocks… long term.
One great feature of the futures, options and FX markets is the leverage. You can start with a modest account relative to stock trading. You get better capital utilization. More bang for your buck.
It’s hard to NOT trade stocks, though. The selection is second to none. The returns over time can be incredible. The 10-year returns for NFLX +2100%, AMZN +1930%, MSFT +1112%, the list goes on. The capital efficiency is not great though. You can do better with options.
I’m surprised by how many people I talk to don’t realize that you can buy options on stocks with long term expiration dates. One year, 18 months, two years. They’re called LEAPS (Long-Term Equity Anticipation Securities). You’ll give up the dividend benefit (if any) but you’ll get great leverage and capital utilization.
Here's an example. My long-term viewpoint on Ford Motors is bullish. Their commitment to the Electric Vehicle space, solid earnings, and manufacturing prowess all suggeste...
The Daily Market Forecast... a HUGE gift for you
Today’s Lesson: How to REALLY learn.
If you could learn anything faster and better would you invest 11 minutes to learn how?
This “gift” you now have access to is truly a life-changer. I know, you’ve heard that phrase “life-changer” or “game-changer” so often it’s probably falling on deaf ears. Give it one more chance. Watch this 11-minute video. The impact on my trading and my life in general was huge. That’s why I want to share it with everyone. Click here for free access.
Trade Well,
Mike Siewruk
P.S. Join us every Saturday morning @ 10:00 ET for our weekly LookBack (5) trade review session. Every trade for the week is analyzed. Now open to the public. Meet the team. Ask questions. Register here.
The Daily Market Forecast... the re-focus hack
Today’s Lesson: Re-focus
Novice traders focus on how much they are winning and losing. Every entry, hoping for a winner. Every stopped exit, wishing it didn’t happen. This is incredibly destructive behavior. You’re teasing your emotions, begging them to overrule your common sense.
Here’s how to stop:
- You have a rule-based trade plan (if not, get one or quit trading).
- You’ve been documenting every trade opportunity including the trades you didn’t take.
- Your database of evidence is rich, hundreds of trades, maybe thousands.
- You know the win/loss percentage of your strategy.
- You know the average winning and losing trade in dollars.
- Calculate the net gain and divide by the total number of trades.
Now you know the amount of money you make every time you click to enter regardless of outcome. That is what your mind should be focused on when a trade setup triggers. Not winning or losing. But knowing with statistical relevance that over the long haul your strategy earns $X per trad...
The Daily Market Forecast... stop placement
Today’s Lesson: Honing your stop placement.
Stops are mandatory orders for risk management. The big question is where to place them. Before we explore different methods, understand that per-trade risk is controlled as much by your position size as your stop placement. Wide stop = less quantity (shares, contracts). Tight stop = more quantity.
Using a fixed percentage formula solves the sizing question. Assuming your account is $10,000, your percentage risk per trade is 2%, your max loss is $200. Now divide that by the stop width and you have position size. Easy enough.
Here is a sample of some popular stop loss placement methods:
- Multiplier of Average True Range (ATR) based on the chart time interval used for entry/exit. The rationale is if your stop is just beyond 1 ATR away then you likely won’t fill it more than half the time.
- Prior candle low plus a few ticks. This also considers the current volatility. Entering when the prior candle is narrow suggests a bigger stop is not re ...
